
Creating and editing analytics
Analytics allow you to visually understand suppliers' submitted data. Analytics can be created from one or more assessments as soon as data has been submitted.
To learn how to publish analytics to your suppliers for anonymous peer benchmarking, click here.
If your assessment contains segments, click here to learn how to use them in analytics.
In this article, you learn how to:
Create analytics
- Click the menu icon
 in the top left corner.
 - Click Analytics.
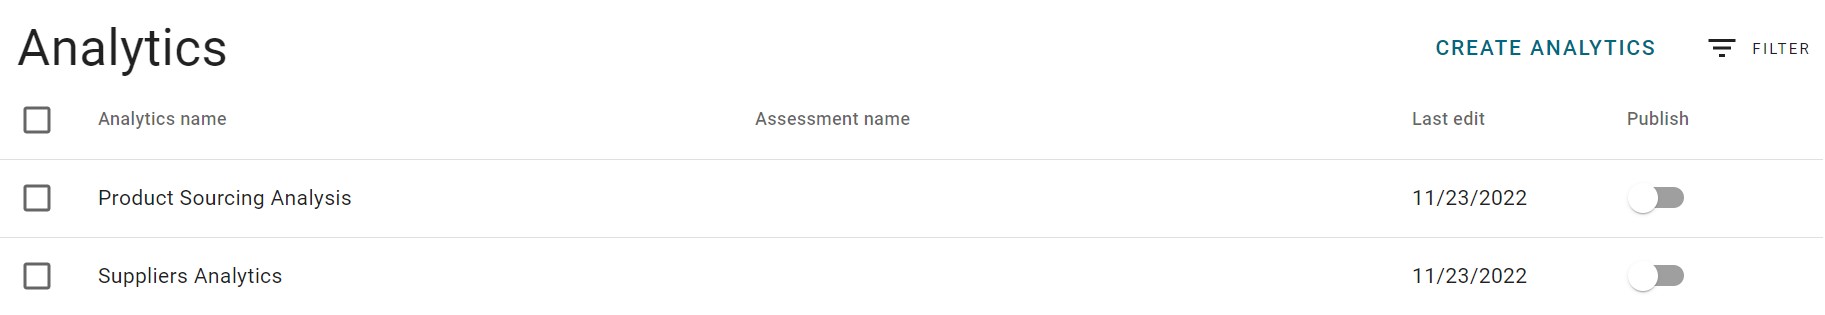
- Click Create Analytics.
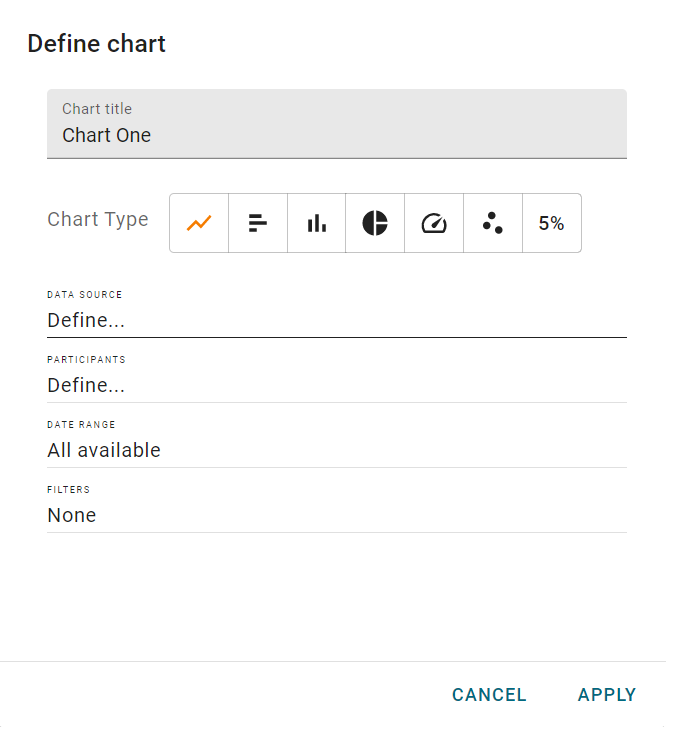
- Enter a title for the new analytic chart you are creating.
- Select the Chart type to display.
- Select the Data Source.
- Define if the chart will analyze Answers or Scores.
- Select the Assessment, Section and Indicator from which the data will be taken.
 in the top left corner.
The Define chart dialog box is displayed.
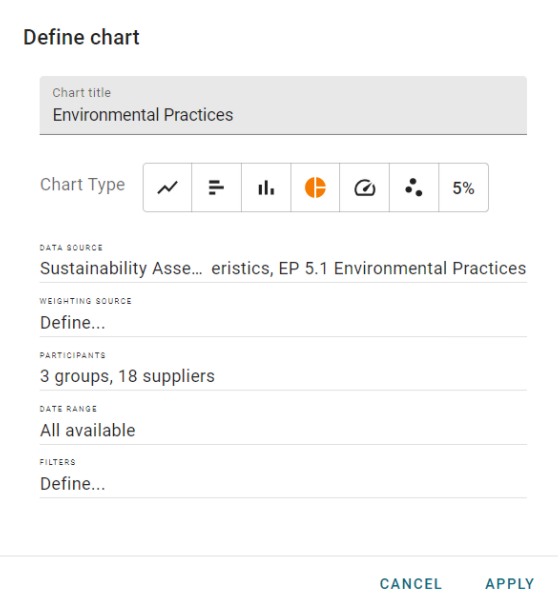
The application displays only the sections and indicators that are appropriate to create the type of chart that was selected for the assessment.
If the chart is created based on Scores, you need to choose what level from which the scoring data should be taken.
- Choose the Participants of the selected source.
- Determine the Date Range.
- Add Filters to the data set.
Choose the specific response option filters.
Assessments must be of the same target to be used together (for example; Company and Company). The application displays only indicators that are appropriate to use as a filter option (e.g., yes/no, multi-select, or multiple choice).
- Click Apply.
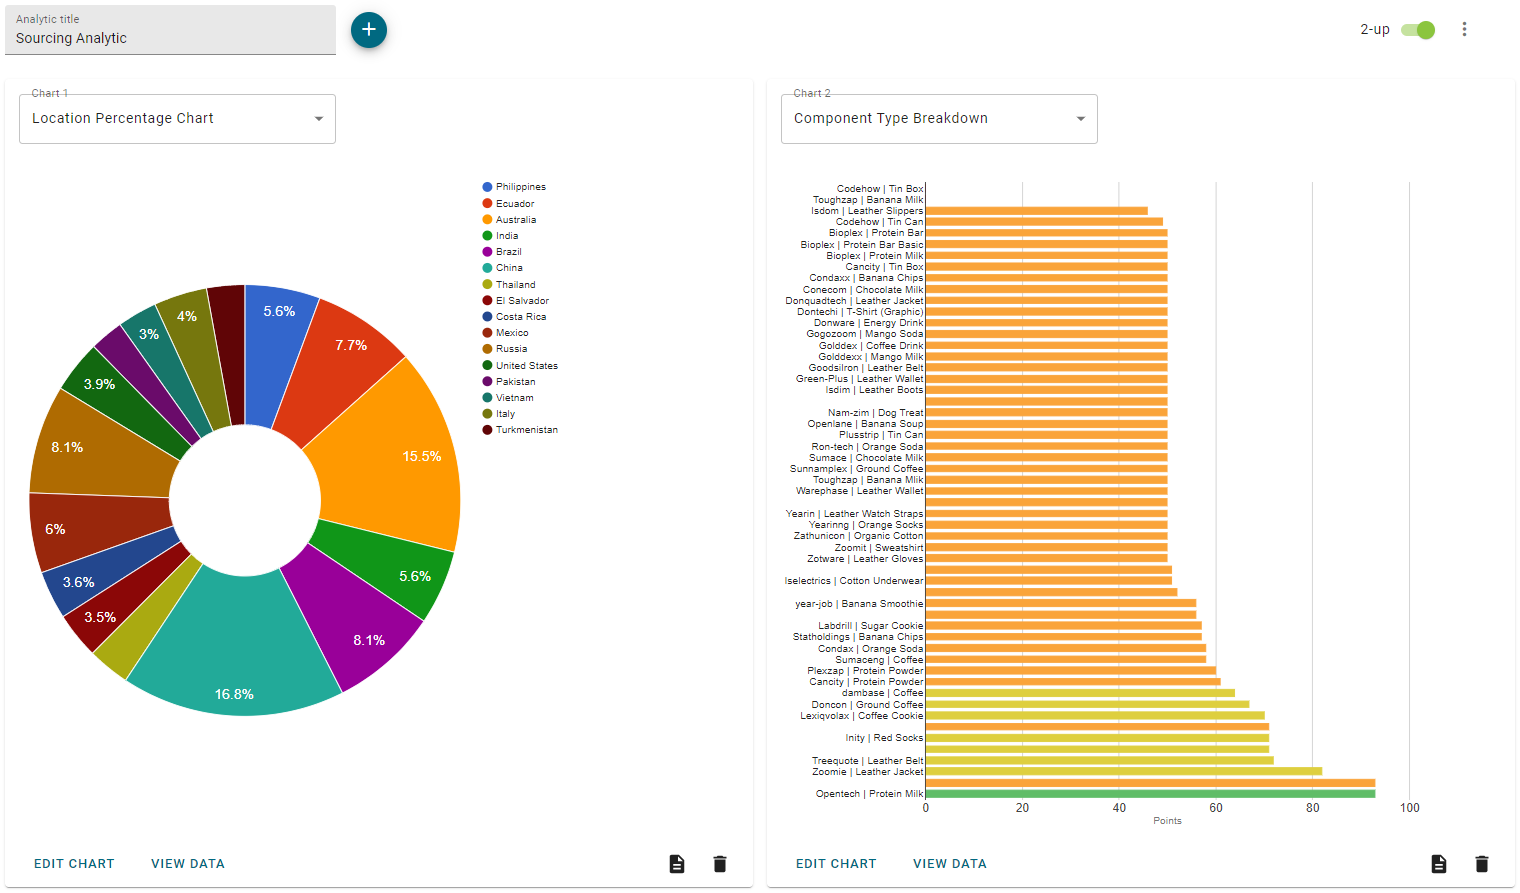
- Add a title to your analytic.
Click the 2-up toggle to view up to two charts at once.
Navigate analytics
- Click the menu icon in the top left corner.
- Click Analytics.
- Click the filter icon
 to search for an analytic.
 - Select an analytic to view.
- Use the drop-down menu to scroll through saved Analytic charts.
 to search for an analytic.
Filters can be applied on published or unpublished analytics.
Click the 2-up toggle to view up to two charts at once.

Edit or delete charts
- Click the menu icon in the top left corner.
- Click Analytics.
- Select the analytic that contains the chart that you want to edit.
- Use the drop-down to select the chart.
- Click Edit Chart on the bottom left.
You can edit all criteria in the chart, however, some details may not be available due to your selections.
- To delete an individual chart, click the trash bin icon
 on the bottom right of the chart.
 - Click delete when the confirmation dialog box is displayed.
 on the bottom right of the chart.
Delete Analytics
- Select the box next to one or more analytics you want to delete.
- Click Delete in the bottom right corner of the page.
- You can also click the trash bin icon to the right of the analytic.
- Click Delete when the confirmation dialog box is displayed.